Balance / a visible comparison
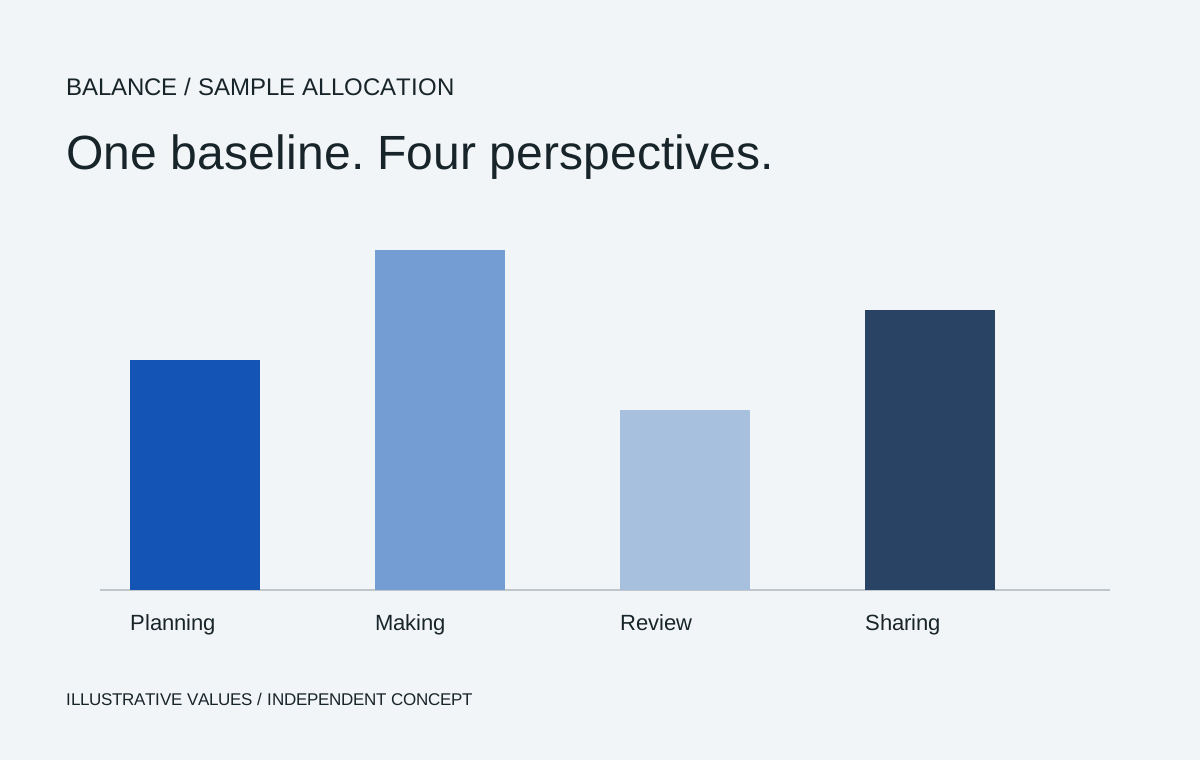
A fictional resource-allocation graphic showing how comparative columns can reveal differences without a crowded dashboard.
Independent concept / illustrative values.
Original information studies
Fictional data and original diagrams, with the decisions behind them.
A fictional resource-allocation graphic showing how comparative columns can reveal differences without a crowded dashboard.
Independent concept / illustrative values.
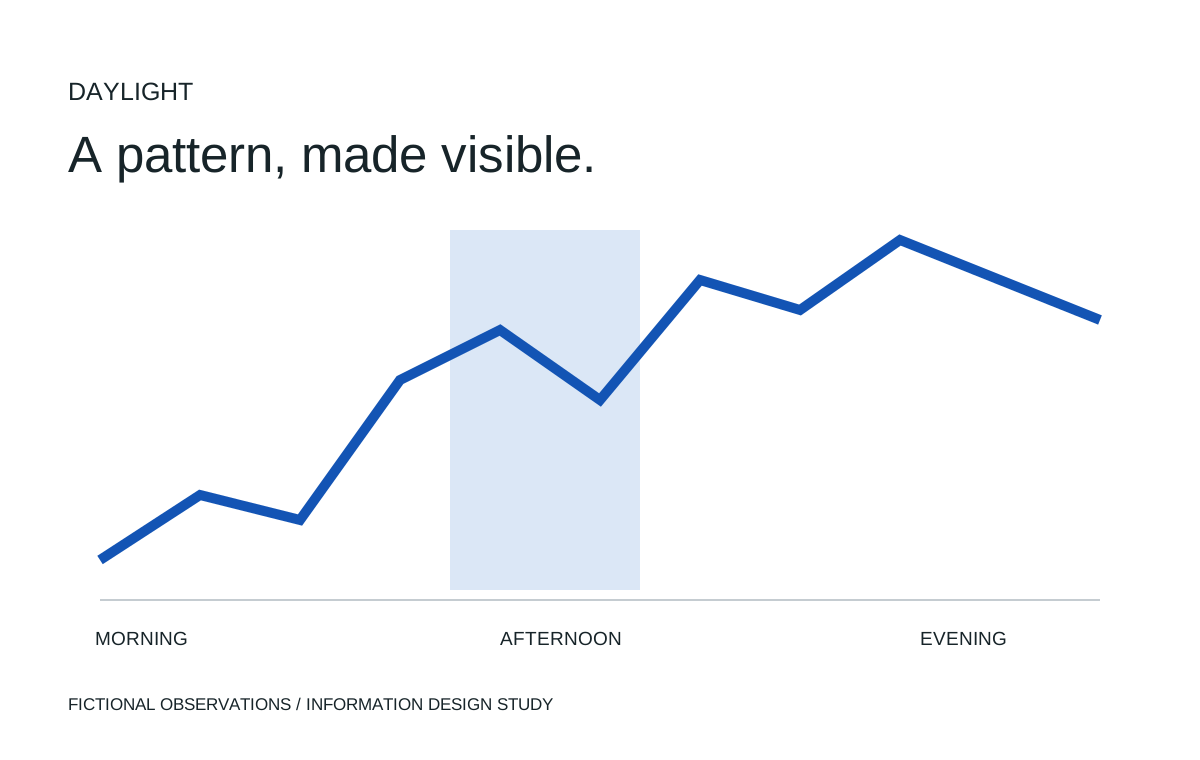
An original time-series study using fictional observations to explore pacing, colour and emphasis.
Independent concept / illustrative values.